
For the Love of Stats – A Lesson For Valentine’s Day
Math Medic
If your students are anything like ours, you know how they can struggle through the long stretch from holiday winter break to spring break. We are always looking for a day in February to break from the standard schedule, whether it’s a weather delay, early dismissal, or a half-day on Valentine’s Day. This year, we will show our students how much we love them with a fun stats activity, instead of giving them a Valentine.
This activity was created after we shared the Trick-or-Treat Halloween Stats Activity, and AP Stats international all-star teacher Corey Andreasen emailed an idea for a Valentine’s Day activity. Here is a link to the data.
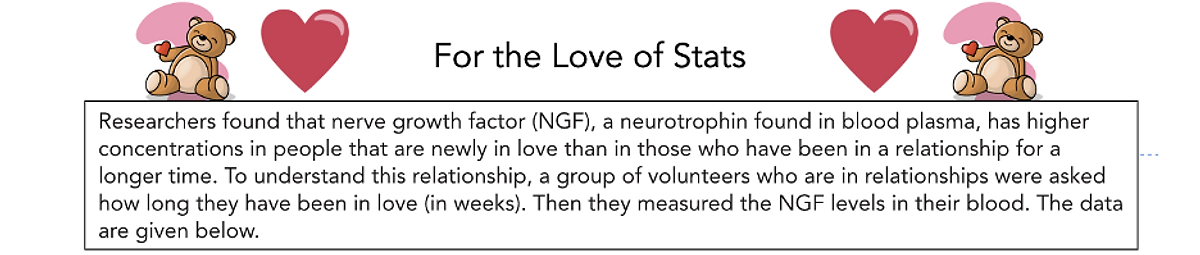
Activity: For the Love of Stats
Download the Activity
Download the Answer Key
Concepts Reviewed in this Activity
Use a calculator to construct a scatterplot.
Describe the relationship between two quantitative variables.
Use a calculator to find the equation of the LSRL.
Find and interpret the coefficient of determination.
Create a residual plot
Assess the appropriateness of a linear model for a given set of data.
The Grand Reveal
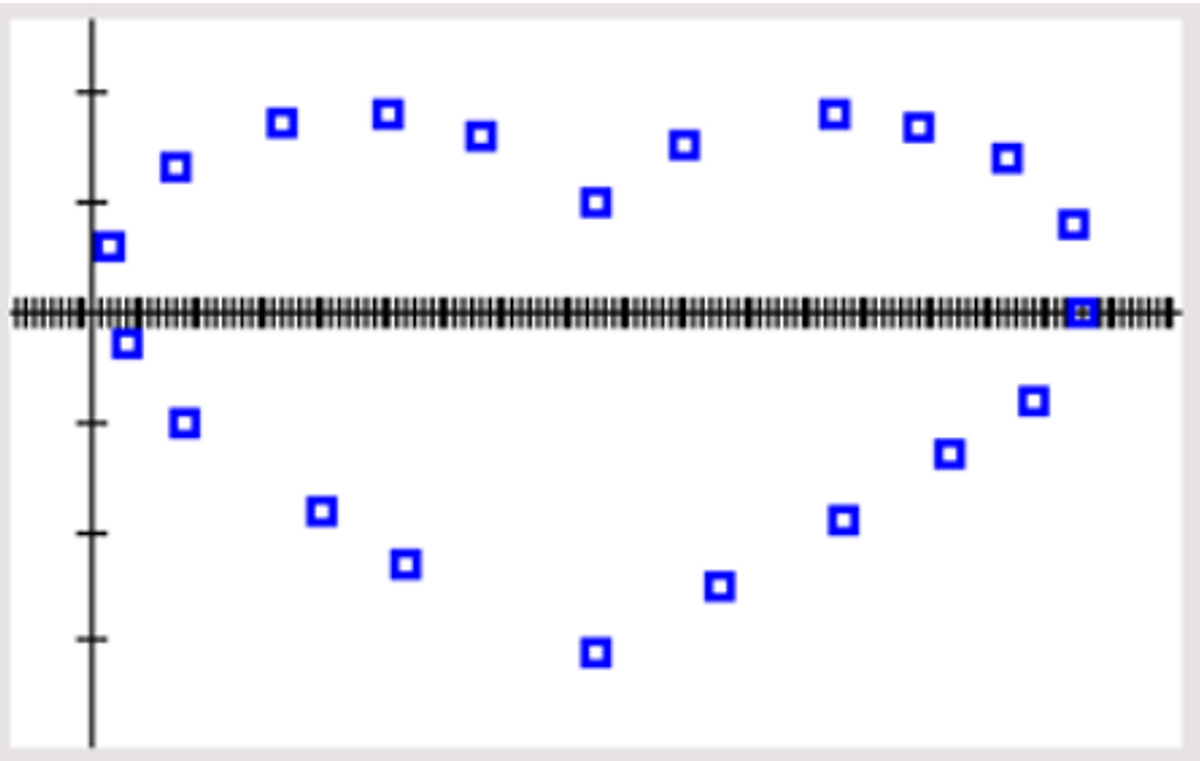
The best part of the activity comes at the end when students fall in love with the residual plot for the data set:
We hope your students enjoy it!