
The Math Medic Ultimate Desmos Guide for the AP® Statistics Exam
Kelly Pendleton
As you may be aware, Desmos is coming to the 2026 AP Statistics Exam! We love Desmos for many reasons, namely:
- It’s free!!!
- It’s intuitive. No more memorizing calculator keystrokes.
- It provides clear visuals to help students make connections.
- And it’s free!!!
Even though it is intuitive, we want to make sure students know how to use Desmos to its full potential and know how to earn full credit on the AP Exam when they are using Desmos, so we’ve created the Math Medic Ultimate Desmos Guide! This guide focuses only on functions that will be most useful on the AP Statistics Exam (not every Desmos function), with a special section in each function for how to show work to get full credit.
Probability Distributions
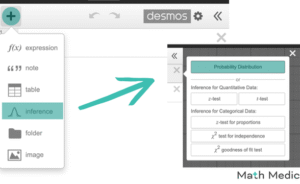
There are 5 probability distributions students should be familiar with on the AP Exam: normal, binomial, geometric, t, and χ^2. Students can calculate probabilities or percentages and find boundaries or critical values by clicking the +, then Inference, then Probability Distributions and choosing the correct distribution. For any probability distribution question on an AP Statistics Free Response Question, students are expected to show the following to earn full credit:
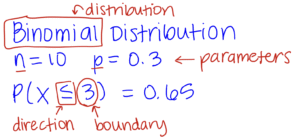
- Identify the distribution (normal, binomial, geometric, t, X^2).
- Define the parameters (μ/σ for normal, n/p for binomial, p for geometric, df for t, and df for X^2).
- Label the boundary (draw a picture or write the probability statement).
- Show the direction (shade the picture or write the probability statement).
Inference
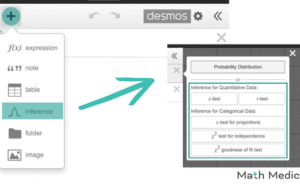
The functions in Inference for Quantitative Data and Inference for Categorical Data are very intuitive, but there are a few things to remind students of as they’re practicing before the AP Exam.
- One- and two-sample procedures are included in each “Test” function.
- Desmos will output both a Confidence Interval and a Significance Test for each “Test” function used, except for chi-square functions.
- For 2-sample t-procedures, you must expand “Significance Test” to see the df used. The t in the Significance Test output is the test statistic and not the critical value t*.
To earn full credit on an AP Statistics Inference FRQ for CALCULATE (using the 4C Method for Inference), students must show the following:
Confidence Intervals
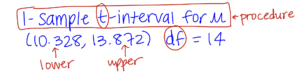
- Procedure name (must include the number of samples, z/t, interval, population parameter) – this is technically part of the CHOOSE step in the 4C Method, but can count for the “formula” so we will include it here.
- Interval (lower bound, upper bound)
- Degrees of freedom, if applicable (only for t-intervals)
Significance Tests
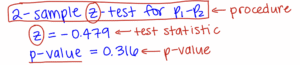
- Procedure name – this is technically part of the CHOOSE step in the 4C Method, but can count for the “formula” so we will include it here.
for z- and t-procedures: must include the number of samples, z/t, test, population parameter
for chi-square tests: chi-square goodness-of-fit test, chi-square test for homogeneity, chi-square test for independence - Test statistic (z = or t = or χ^2 = ) and p-value
- Degrees of freedom, if applicable (t-tests and chi-square tests)
Download the guide and show the video to your classes as you begin preparing for the AP Exam!
DOWNLOAD: Math Medic Ultimate Desmos Guide
The Math Medic Ultimate Desmos Guide is one of the many resources available as part of the Math Medic AP Stats Exam Review Course.
VIDEO: Math Medic Ultimate Demos Guide
If your students are used to handheld calculators, show them this blog post for TI-84 and NumWorks guides!
About the Author

Kelly Pendleton
Kelly has the fun job of writing questions for the assessment platforms and free lessons. As an AP Stats teacher at Ardrey Kell High School in Charlotte, NC, she loves coming up with interesting and engaging scenarios to keep students on their toes! Kelly is all-in on the “EFFL revolution” (as she calls it) and uses it with her own students, even online during the pandemic. Kelly is passionate about schools having equal access to quality materials no matter where they’re located and loves that Math Medic is helping to better that. If you see her in person, she’s the tall one who’s probably munching on popcorn.