
But That’s Not Required on the AP Stats Exam!
Kelly Pendleton
In the world of AP Statistics, the AP Exam is the pinnacle of the year for both teachers and students. Forty-two multiple-choice questions and four free-response questions are all students get to demonstrate an understanding of introductory statistics. But when you start to think about teaching the discipline of statistics, what is the primary mission? Of course we want students to do well on the AP Exam, but there’s more to statistics than successfully answering 46 questions in a 3-hour period. We want them to be critical thinkers, clear communicators, and responsible citizens. To accomplish this, we have to think beyond the AP Exam.
There are three examples that come to mind when thinking about teaching more than is required by the AP Exam: sketching normal distributions, combining random variables, and interpreting p-values. In this blog, I will explain how each of these concepts is related to the bigger picture of statistics and why you should consider making extra time for them throughout the year.
1. Sketching Normal Distributions
When I first started teaching statistics, I found the idea of calculating a z-score and finding the area with Table A to be cumbersome. I tried to bypass it by heading straight for normalcdf. Later in the year when we started calculating test statistics, I found myself wishing I had spent more time training my students on the importance of thinking about the z-scores. Consider this example:
The weights of eggs labeled “large” at a local farm are approximately normally distributed with a mean of 57 grams and a standard deviation of 2.5 grams. What proportion of these eggs weigh more than 64 grams?
To think through answers that make sense, drawing the normal curve helps students visualize the area under the curve. And calculating a z-score makes the connection between the boundary value in question and how far it is from the mean relative to other values in the distribution. This is essential when reasoning with test statistics, which are just fancy z-scores, in later units!
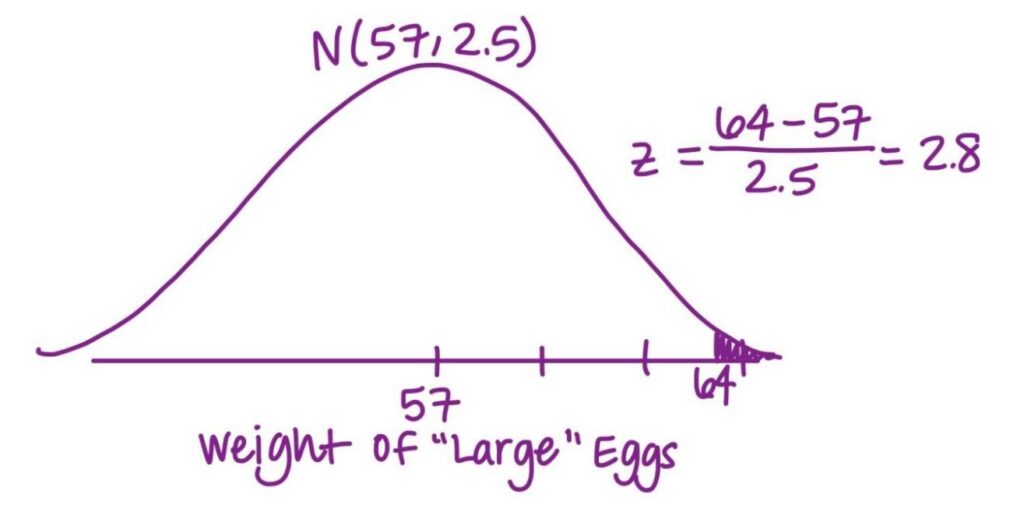
Now that students will be typing their responses into a computer for the AP Exam, you may be tempted to go straight to the calculator/Desmos to get the answer, bypassing the sketches and z-scores altogether. However, I encourage you to keep expectations high for your students as they are building these foundational concepts in your classroom. Drawing, labeling, and shading the normal curve gives students something tangible to connect to the proportion of values in the distribution that satisfy the condition. As they shade a very small area on their paper, they know the answer should be very small (less than 0.05?). When they calculate a z-score, they are able to visualize where the boundary value is in relation to the mean.
2. Combining Random Variables
Now let’s talk about something that was removed from the most recent AP Statistics Course and Exam Description: Combining Random Variables. With this topic out of the new CED, how do you teach sampling distributions for the difference between two sample proportions (or means) without just waving a magic wand and providing the formulas? See the required course content for AP Statistics Topic 3.9 here:
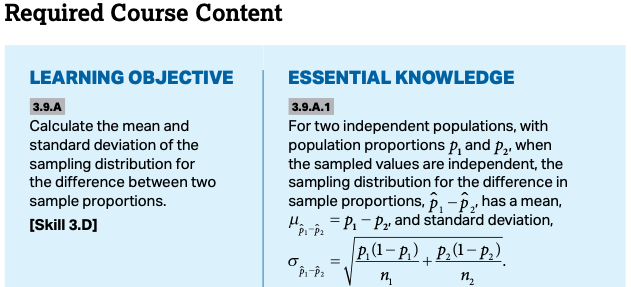
The formulas for mean and standard deviation come directly from combining two independent distributions. In the Math Medic curriculum, students learn combining random variables in Lesson 4.5 so that they can make sense of the new sampling distribution learned in Lesson 5.4:
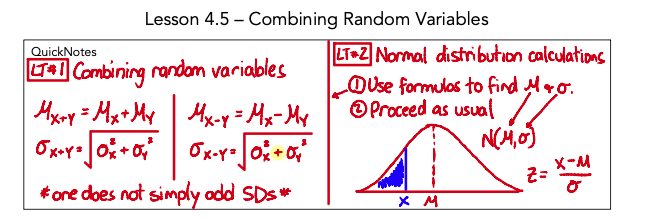

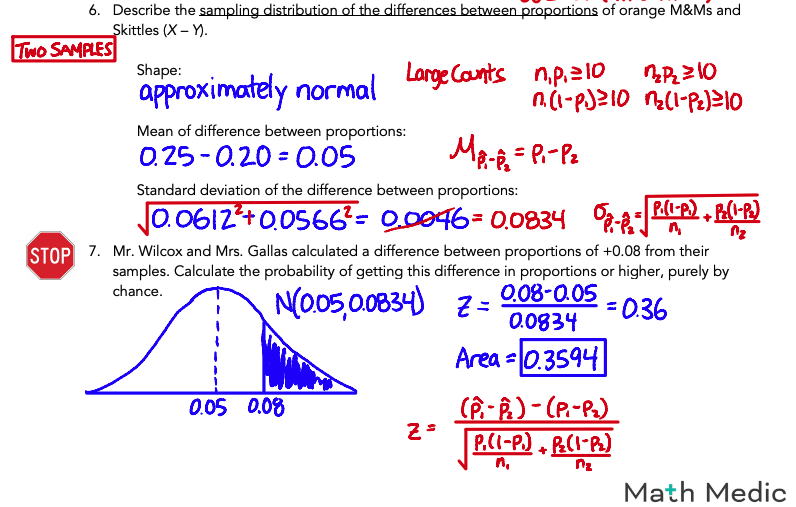
Notice what else is present in Lesson 5.4? That z-score that will eventually turn into a test statistic (and a p-value)! The interconnectedness of statistics is too valuable to skip over concepts just because they’re not in the newest CED.
3. Interpreting p-values
This brings me to one of my favorite topics in statistics: the p-value. Why do we want our students to draw those normal curves? So they can visualize and interpret the p-value. Why do we develop those formulas when creating sampling distributions? So our students can use the test statistic to calculate a p-value. Everything points back to the p-value, which is why we consider interpreting the p-value an integral part of our hypothesis test conclusions.
“Assuming there is no difference between the population means, there is a 0.0002 probability of getting our sample results or more extreme (in either direction) purely by chance.” Wow–that’s quite unlikely! We must have some really convincing statistical evidence here!
Now of course we know that you can (and should) do less on the AP Exam. Students should not try to draw a perfect normal curve with their mouse in Bluebook (is that even possible?), nor should they worry about combining random variables formulas or interpreting p-values in their hypothesis test conclusions. The bare minimum (0.0002 < 0.05, so we reject H0 and do have convincing statistical evidence of Ha in context) can earn full credit. But that doesn’t mean we should expect the bare minimum throughout the school year as well. This is why we are vigilant about our primary mission.
Clear communicators show their thinking with visual aids. Critical thinkers can reason about where formulas come from and how distributions are developed. And responsible citizens know the significance (pun intended) of convincing evidence. If you stick to these high expectations throughout the year, you’ll have all of this AND students who will perform well on their AP Exam!
About the Author

Kelly Pendleton
Kelly was a high school math teacher for over 10 years in Charlotte, NC before joining the Math Medic team full time. At Math Medic, she is a member of the content team and is responsible for all statistics-related content. You’ll also find her writing weekly newsletters, leading workshops, and working to improve teachers’ experience in the assessment platform. Kelly is passionate about schools having equal access to quality materials no matter where they’re located and loves that Math Medic is helping to better that.